
Categorical Plots | Plotting in Python
What is categorical:
Like numerical values which possess numbers, categorical values possess categories such as gender (contains two categorical values ) , year ( contains 12 categorical values ). Now we will be using another data set named ‘tips’ , which provides data of some kind of flowers. All these data sets are directly available in jupyter notebook provided by seaborn library by plotting in Python.
There are many different plots such as
- Categorical scatter plots
- stripplot ( ) kind = ‘strip’
- swarmplot ( ) kind = ‘swarm’
- Categorical distribution plots
- boxplot ( ) kind = ‘box’
- violinplot ( ) kind = ‘violin’
- boxenplot ( ) kind = ‘boxen’
- Categorical estimate plots
- pointplot ( ) kind=’point’
- barplot ( ) kind =’bar’
- countplot ( ) kind =’count’
The basic categorical plot representation is catplot( ) which can be used for any of the above plots just by passing the kind parameter in the catplot( ).
Now we shall work with each of the categorical plots:
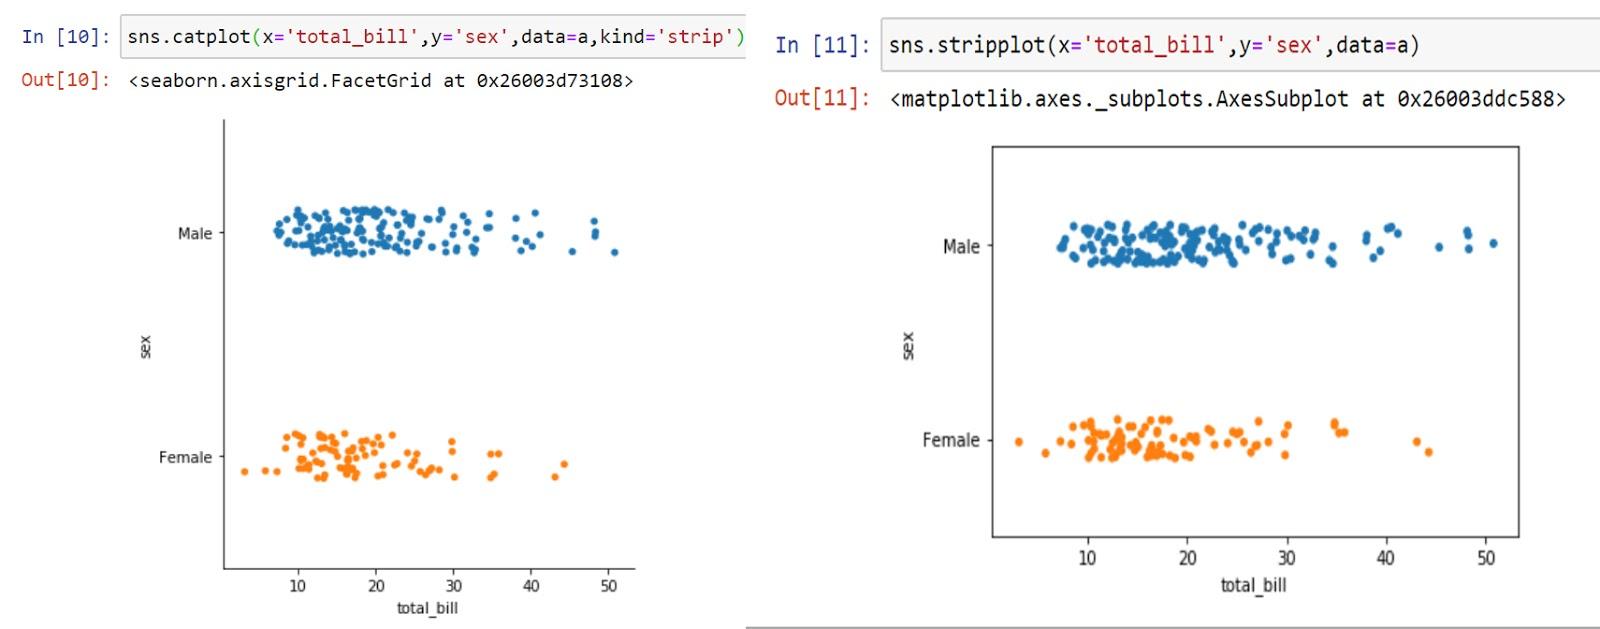
stripplot( ):
This is a plot that is basically plotted across a categorical value and a numerical value.
Syntax: sns.stripplot( x = ‘value’ , y= ‘value’, data= dataset_name )
Another syntax: sns.catplot ( x = ‘value’ , y= ‘value’, data= dataset_name , kind = ‘strip’ )
As mentioned above catplot( ) can be used as all in one, let’s check output for both:
Important parameters:
Many parameters are common in other plots such as hue , color and we will not be repeating them all the time.
| Parameters | It’s usage |
| jitter | Default it is true, which means all the plotted points are spreaded instead of in a straight line, refer output image below for proper understanding. |
| dodge | When using hue option all the plots get overlapped, setting this to true will divide them. |
| orient | Pass a string either v or h which means vertical or horizontal orientation. |
jitter = False

Refer to the first image to check the difference.
dodge:

swarmplot ( ):
This plot is similar to stripplot( ) , but these plots don’t overlap each other, they are aligned across the categorical axis.
Syntax: sns.swarmplot( x = ‘value’ , y= ‘value’, data= dataset_name )
Another syntax: sns.catplot ( x = ‘value’ , y= ‘value’, data= dataset_name , kind = ‘swarm’ )
Let us understand this more clearly

The parameters of this plot are almost the same to that of the strip plot in this way we have to perform plotting in Python.
In the next tutorial we would continue with our remaining categorical plots.